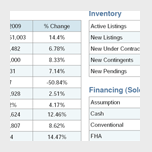
| County | Median Sold Price | Change from February 2020 | Change from last month |
|---|
Please Login or Register to see Zip Code Report
RBI Sign In
February 2021 Real Estate Market Statistics for
Greater Charlottesville
February 2021 Summary
| Statistic | Values | YoY | MoM |
|---|---|---|---|
| Total Sold Dollar Volume | $102,411,854 | +38.47% | -17.98% |
| Closed Sales | 242 | +22.22% | -17.41% |
| Median Sold Price | $343,828 | +7.36% | -6.63% |
| Avg Sold Price | $423,189 | +13.29% | -0.7% |
| Avg Days on Market | 52 days | -45.26% | +4% |
| Avg Sold to Orig List Ratio | 99.08% | +3.84% | +1.05% |
February 2021 Summary:
Market Activity | Greater Charlottesville
There are no matching locations in the RBI/MLS database. Please enter a valid Region, County/City or ZIP code.
OkGreater Charlottesville
There are no matching locations in the RBI/MLS database. Please enter a valid Region, County/City or ZIP code.
OkGreater Charlottesville
There are no matching locations in the RBI/MLS database. Please enter a valid Region, County/City or ZIP code.
OkAvg Sold to Orig List Price Ratio | Greater Charlottesville
There are no matching locations in the RBI/MLS database. Please enter a valid Region, County/City or ZIP code.
OkRBI Reports
Collection of Stats. Print them. Pass them on.
Don't have time to grab and share individual charts? Looking for an all-encompassing view of important charts and market indicators? We've done the legwork to compile both a summary and detailed view for you. Print either the Local Market Insight Report as a summary, or print the Monthly Market Statistics - Detailed Report to help you analyze your market area.
Greater Charlottesville Reports

Detailed Reports
These reports convey critical market indicators of the most recent period compared with that period last year. The spreadsheet format shows these figures for all properties as well as breakdowns by property type and price range. rbiEXPERT subscribers have exclusive access to quarterly, yearly, and year-to-date views.

Local Market Insight Report
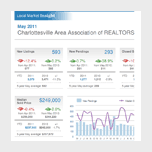
Updated monthly, the LMI offers a snapshot of how this area's market is performing compared to last month, last year and 5-year historical averages. rbiEXPERT subscribers have exclusive access to the LMI by home type, offering narrative and infographics particular to that specific segment of the local market.
Explore Greater Charlottesville
Select a metric from the choices on the left to explore the information for the current geographic location. The areas within this location are listed along with the metric values, the change in value from the same month last year, and the change from last month to see which areas are moving in positive or negative directions. Click on the headers to sort by any of the items listed. Explore the metrics to find information you can use with your social media campaigns, newsletters or other communications to your clients and customers.
